During the past year I logged every single thing I watched. I noted down the title, the date I watched it on, if it was film or tv, the runtime and the medium (what I watched it on or which cinema I watched it in). Since I don't have a tv I watch a lot of tv through online services like BBC iPlayer or DVD's. I ended up with a huge list of data which I'll spare you, but I have compiled them into a few charts. These are the results. (Note: All the percentages are based on runtimes.)
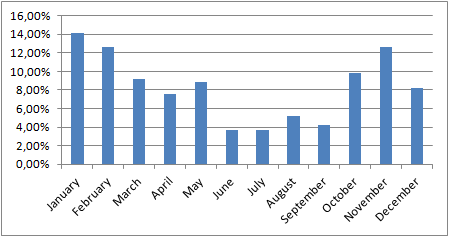
Overall percentage per month
The month I watched the most film and TV in was January. Then there was a steady decline when the days got longer, and an increase near the end of the year again.
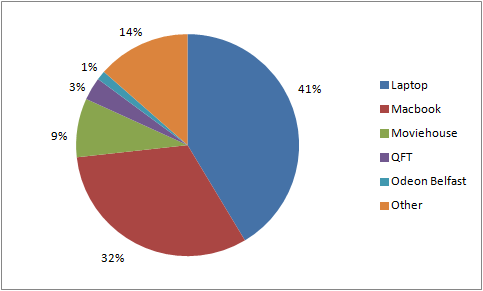
Pie chart of the mediums
I watched the most stuff on my laptop and on the Macbook I bought in august. The category 'Other' means all other places I watched something, like in Belgium, on my girlfriends laptop or cinemas I went to only once.
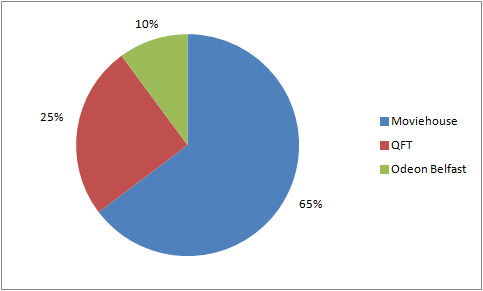
Pie chart of cinemas I went to
I mostly go to 3 different cinemas here in Belfast: Moviehouse, Odeon and Queen's Film Theatre. Queen's Film theatre is a small cinema with two screens that shows the lesser known films. The reason I went to Moviehouse a lot more than Odeon is because it's a it closer and I only found out Odeon has a £3 deal on Tuesday until later.
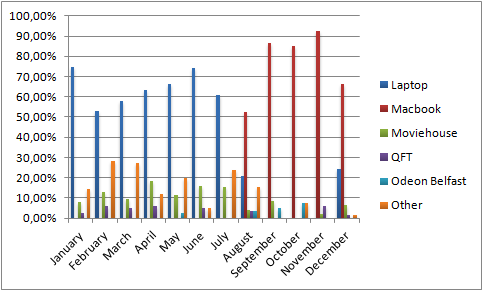
Bar chart of mediums over the year
These are the percentages of where I watched things per month over the whole year. I clearly watch a lot more on my laptop or Macbook than anything else. There's also a clear switch from laptop to Macbook when I bought it in august. The laptop is there again in December since my Macbook broke.
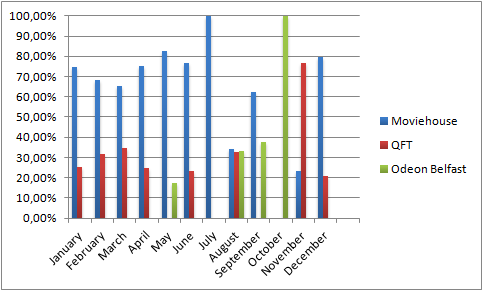
Bar chart of cinemas over the year
This is the percentage of the three cinemas I frequented in relation to each other over the year. There's a clear rise in August for Odeon when I realised they had a £3 deal on Tuesday, although it's a bit further than Moviehouse and QFT so that still kept me away.
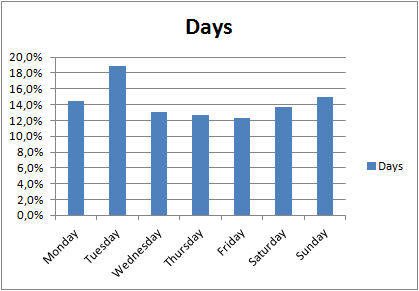
Bar chart of days of the week
This chart shows the amount I watched per day in relation to each other. There's a clear peak on tuesday, which I think is mainly because Moviehouse and Odeon have a £3 deal.
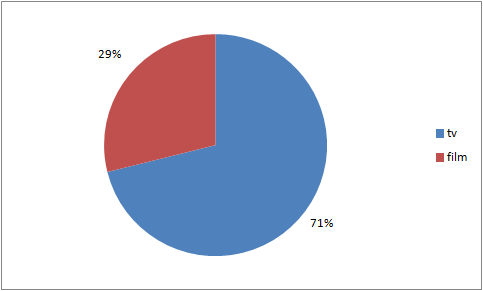
Pie chart of Film vs TV
This shows the difference between film and TV I watched in 2012. The percentage is based on runtime. I clearly spent a lot more time watching TV than Film. I think this is because I'd rather watch a 30 minute episode of a TV series than a whole 2 hour film, but in the end I might end up watching 5 episodes.
Seeing the entire list of everything I watched it scared me how much time I spent in front of a screen. My new year's resolution is actually to watch less.
In 2013 I'll be making this list again, this time I will include the country it has been produced in and the year it came out.
Seeing the entire list of everything I watched it scared me how much time I spent in front of a screen. My new year's resolution is actually to watch less.
In 2013 I'll be making this list again, this time I will include the country it has been produced in and the year it came out.
 RSS Feed